Google Earth now shows climate change in time lapse

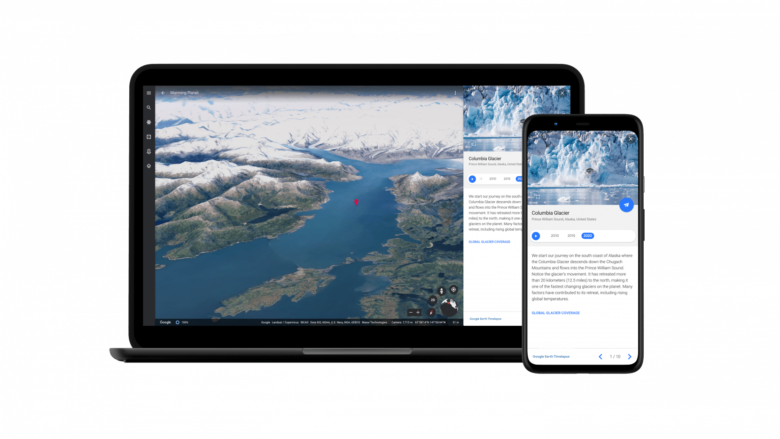
Change is an unstoppable process. This almost philosophical introduction describes what the latest update of Google Earth is all about, among other things. The Timelapse interactive tool shows the changes that took place on earth from 1984 to 2020 in 4D. The goal is to offer easy-to-understand information about climate changes divided in five themes
The themes used in Timelapse are forest change, urban growth, warming temperatures, sources of energy, and fragile beauty. For example, people from all over the world can watch how polar ice caps have melted over the years. The project is part of Google’s efforts to raise awareness of climate change impact, the tech giant said in a statement.
24 million satellite images used
A total of 24 million satellite images have been used to cover the 37-period from 1984 to 2020, Google said. The update took a total of two million computing hours on thousands of machines in climate-neutral data centers, using 100% renewable energy.
Annual update planned
The division of the themes was implemented together with the Create Lab at Carnegie Mellon University, Google said. And work is not to stop here. The company plans to update their time-lapse database in collaboration with NASA and ESA every year all the way through 2030.
+++Coronavirus: An Interactive Map Shows The Spread Of The Infection Real-Time+++


